interactive
-
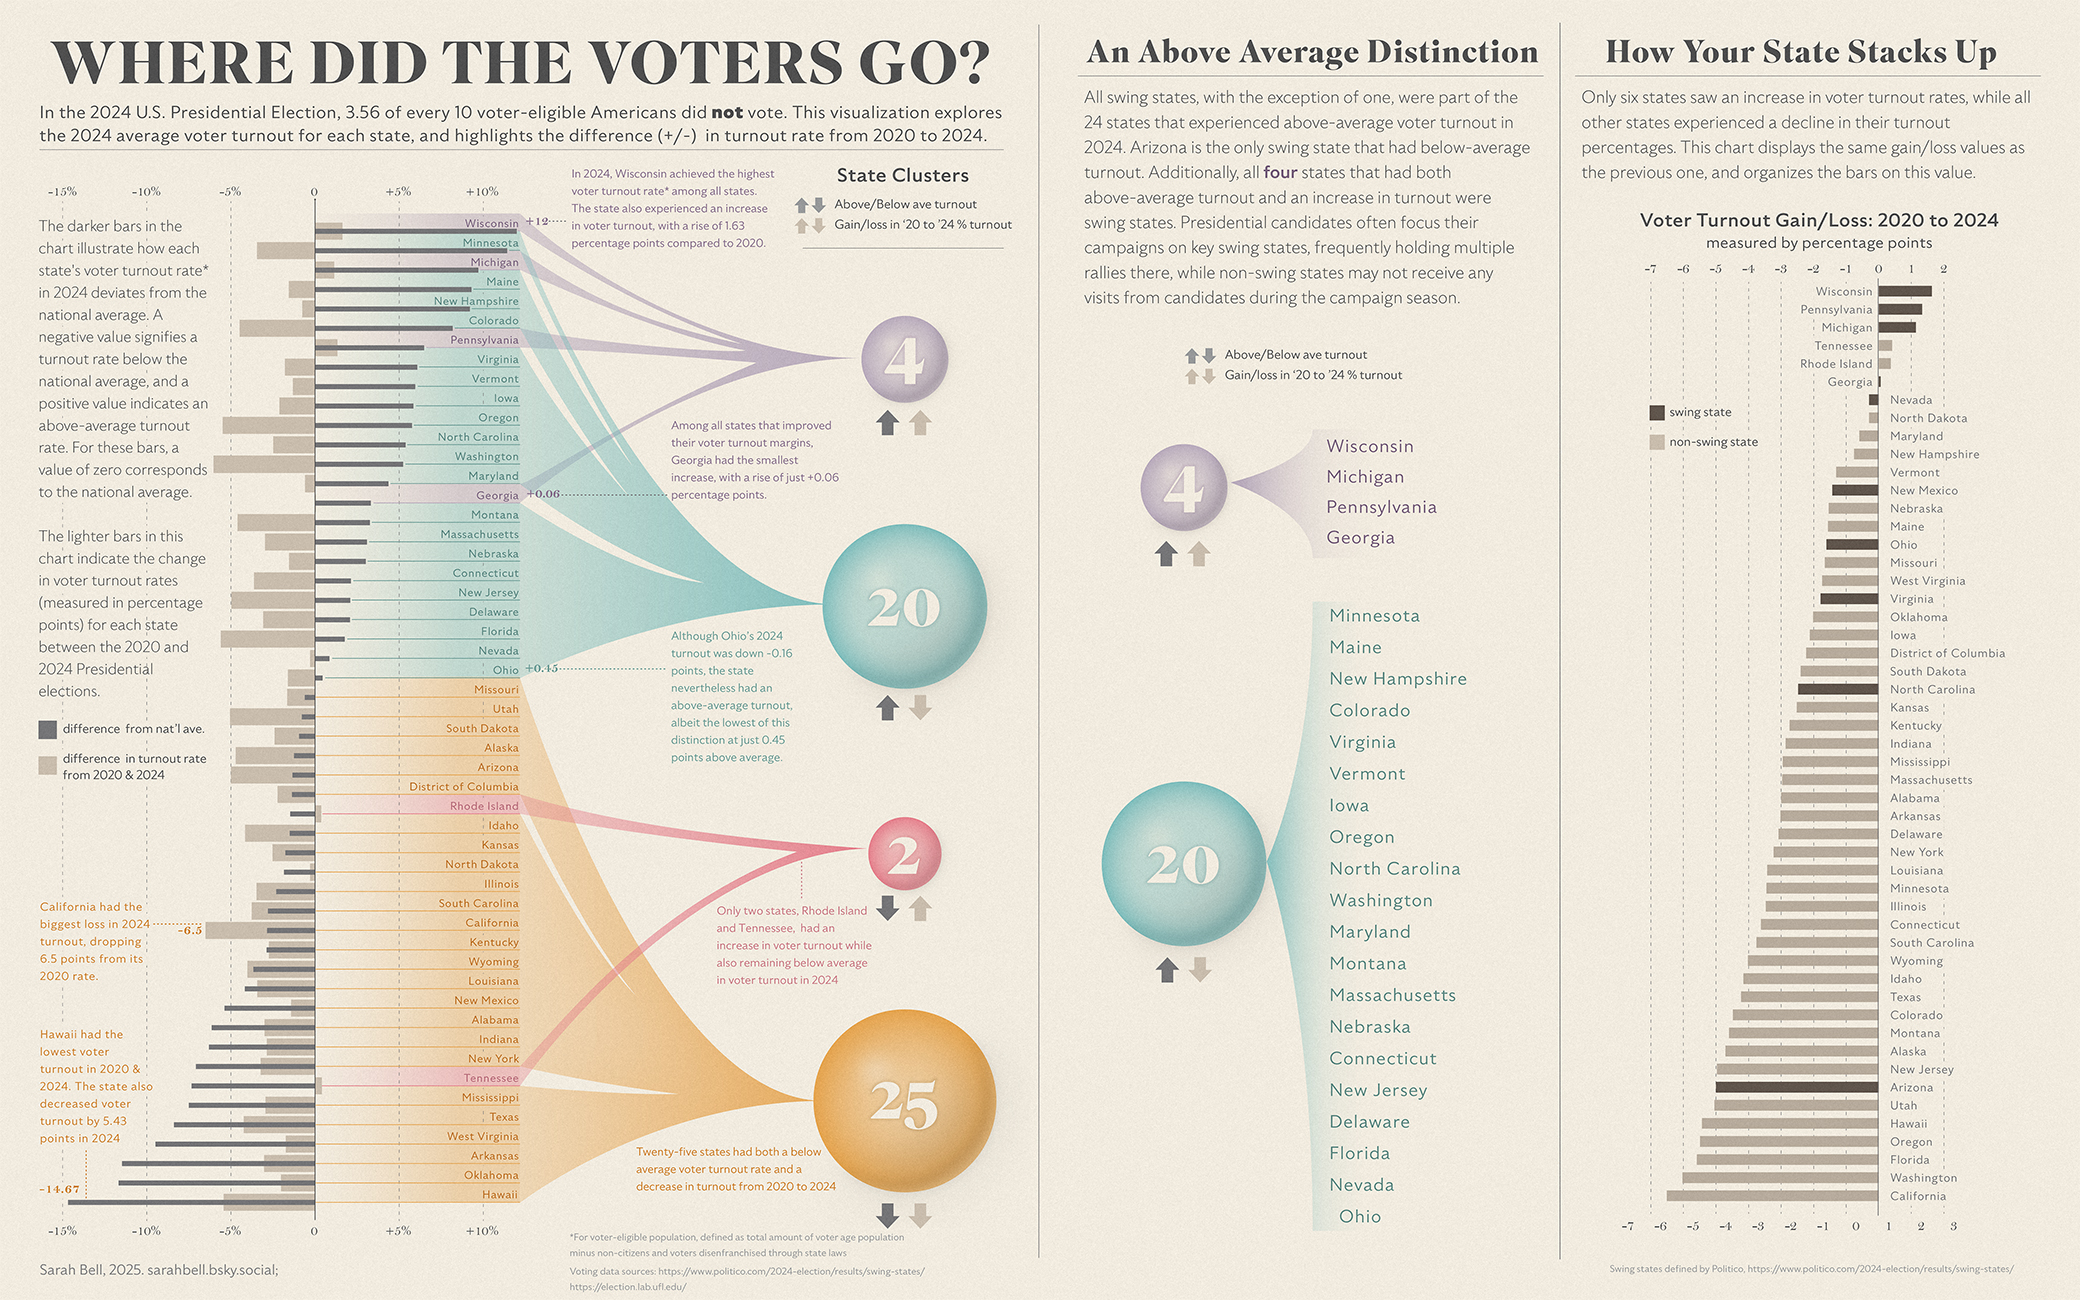
Exploring Various Visualization Methods using Voting Data, D3, and Cartography
Interactive map and data visualizations created with d3 to depict the drop in voters from 2020-2024.
Interactive map and data visualizations created with d3 to depict the drop in voters from 2020-2024.