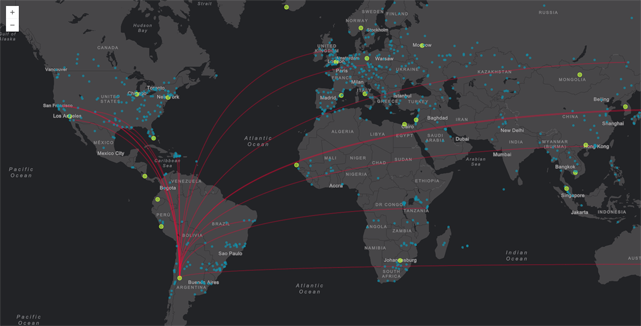
Event 1. Demand
This custom (and customizable) Leaflet layer plug-in maps geographic data to the html canvas. It was born out of a few events that serendipidously occurred around the same time. I had been working with a lot of customers with big datasets of their company logitstical assets, for example warehouses, factories, and stores. The requests were typically along the lines of wanting to see the connectivity of it all simultaneously. This request was not difficult to deliver, but since these were huge global datasets, the result would be so messy that no useful information could really be gleaned from it. Well, other than a very good depiction of how complex a large company’s logistics can be. And I knew this before I fulfilled the request. So I did something that I wish more skilled cartographers had the time and resources to do: I built two versions:
- The version the client is asking for
- The version I think will work better
I built the requested version first, and designed it well. It was a static map with a bunch of nodes on a map connected by their relationships. So there were a ton of lines criss-crossing the map. Keep in mind, this was a global dataset. The route that connected the lines was irrelevent, so they were straight lines.
I didn’t like the straight lines, so I had the lines follow Earth’s curvature. While this meant that each line would have a slightly or drammatically different appearance, these geodetic lines each follow the same mathematical rules, and so a ton of them together just feels visually less jarring than the pick-up-sticks (hooray for old toys!) appearance of straight lines.
While the route of the connecting lines didn’t matter to this particular visualization, the relationship did. As did the type of node. Thus, the nodes and the lines all required categorical symbology. Let’s go back to the example – say your company has 15 factories across the world. These factories ship to 75 warehouses. The warehouses deliver goods to 850 stores. You’d have 940 points on your map. And factories can ship to more than one warehouse. And warehouses ship to multiple stores. Then you need to consider production, volume, sales, etc. Suddenly you realize you can apply graduated symbology to each of the points. And the volume of shipping can be indicated by a thinner or thicker line. What about direction?
To be fair, nobody could really know to ask for the second version. It was mostly my attempt at easing my own pain of creating what I called a visual cacaphony, a beautiful mess, or what my cartography professor called “eye candy” when he was referring to beautiful dataviz-heavy maps that uncovered very little information about the data. Sidenote: I enjoy the eye candy maps. The first version that I made, although “eye candy,” still told a story about the data. Firstly, there was a global footprint view of the logistical pattern. Second, there was no mistaking that the relationships between the assets were complex. I avoid the practice of degrading others’ approaches to mapping. Doing so seems antiquated, hyper-elitist, and unproductive; it can quiet the spatial voice of someone who has something very important to say – someone that I can learn from.
Sidenote over.
The second version was a simple change: I made the lines that connected the nodes into Bézier curves. This simple made the visualziation much less harsh. It was still static, so there were still a ton of criss-crossing lines, but it still easier to see the relationship between nodes.
I cannot share these actual real customer projects, but I did create new versions with fake data that can be seen in my NACIS presentation with my collaborator Jacob Wasilkowski.
Event 2. Desire to solve the visualization with interactivity
Although the Bézier curves illuminated the relationships between nodes a little better, static views require everything to be “on” all the time. What if you could click on one of the points, like a store, and see all the warehouses that deliver to that one store? How about directionality? This is when I asked my friend, Jacob Wasilkowski to collaborate on an interactive version. To read about the details of this project, check out my github page. To use it yourself, check out Jacob’s page.
